Theoretical Framework
Market Structure
Market structure is a key component of price action. The Price Action Suite toolkit automatically detects and highlights real-time market structure on your chart. This feature provides a clear view of market trends without relying on traditional technical analysis methods like moving averages.
Type Of Market Structures


Market structure allows traders to understand trend reversals as well as trend continuations in the market through two distinct identifications:
- Change of Character (CHoCH)
- Break of Structure (BOS)
These are further described in the subsections below.
Change Of Character (CHoCH)

A change of character (CHoCH), also known as a ‘market structure shift,’ occurs when the price breaks a prior swing low during an uptrend (bullish CHoCH) or a prior swing high during a downtrend (bearish CHoCH). This indicates a potential market reversal.
The Price Action Suite toolkits identify two distinct types of CHoCHs:
- Leading CHoCH (labeled as CHoCH)
- Supported CHoCH (labeled as CHoCH+)
The distinction between these types is based on the relative position of prior swing highs and lows. A leading CHoCH is characterized by the absence of prior reversal signs, such as a failed higher high (lower high) during an uptrend or a failed lower low (higher low) during a downtrend.
In contrast, a supported CHoCH (CHoCH+) is preceded by an early sign of market reversal, such as a failed higher high (lower high) during an uptrend or a failed lower low (higher low) during a downtrend.
Users can allow the toolkit to show all types of CHoCHs or only specific types through the drop-down menus in the Market Structure settings section of the toolkit.
Break Of Structure (BOS)

A break of structure (BOS) primarily serves as a trend continuation indicator. This structure is the opposite of the CHoCH. A BOS occurs when the price breaks a prior swing high during an uptrend, indicating a bullish BOS and forming a new higher high. Conversely, during a downtrend, a BOS is identified when the price breaks a prior swing low, resulting in a bearish BOS and a new lower low. A BOS can only occur after a CHoCH.
Since BOSs indicate trend continuations, it is common to observe successive BOSs.
Swing & Internal Structure
The Price Action Suite toolkit offers two distinct dimensions related to market structure:

Internal Structure
Swing Structure
Internal structures are formed from shorter-term swing high and low points, while swing structures are created from longer-term ones. Users can choose the lookback period for swing point detection for both internal and swing market structures.
Internal structures can use a lookback range of 5 to 49, whereas swing structures can use a lookback range of 50 to 100.
The toolkit highlights internal structures with dashed lines and labels them in a smaller text size.
The size of the labels for internal and swing structure can be changed from the General Styling settings section.
Volumetric Order Blocks
An Order Block (OB) is a zone with a significant number of limit orders, leading to notable market reactions when the price reaches these areas. The Price Action Toolkit automatically identifies and maps Order Blocks on your chart.

Volumetric Order Blocks identify price areas where informed market participants accumulate orders. These areas can serve as potential support or resistance levels. The toolkit automatically highlights them, and they will disappear once mitigated.
Volumetric Info
Enabling volumetric information adds a layer of analysis by linking volume data with Order Blocks. This assists traders in evaluating the strength and reliability of the zones. Volume profiles for each Order Block illustrate total volume, high/low volume ratios, and visual representations of volume activity within the gap.
Total Volume: Displays the combined volume for the bars that comprise the Order Block, providing a clear indication of market participation in the gap.
Percentage Ratio: Shows the proportion of high volume compared to low volume within the Order Block.
Low Percentage: Indicates whether buyers or sellers dominate, depending on whether the Order Block is bullish or bearish.
High Percentage: Suggests reduced volume support for the Order Block’s direction, implying that the zone may be less reliable.
Volume Bars Visualization: Displays the buying versus selling volume in the Order Block.

These order blocks are divided into two types: bullish volumetric order blocks and bearish volumetric order blocks. Bullish volumetric order blocks are typically found near swing lows and serve as potential support levels. In contrast, bearish volumetric order blocks are located near swing highs and act as potential resistance levels.
Users can display longer-term volumetric order blocks by increasing the Length setting in the Order Blocks section. This setting controls the lookback period for swing point detection used to construct volumetric order blocks.

Breaker Blocks
A Breaker Block (BB) is an invalidated Order Block (OB) that signals a shift in market structure, moving from bullish to bearish or vice versa. The Price Action Toolkit automatically identifies and marks Breaker Blocks on your chart.

Breaker Blocks represent previous Volumetric Order Blocks that have been mitigated (broken by price). These zones can be re-approached by the price and serve as support or resistance areas.
Bullish breaker blocks are eliminated once the price rises above their upper extremity, while bearish breaker blocks disappear once the price falls below their lower extremity.
Users can activate the option to display breaker blocks by enabling the “Show Breakers” setting.
Fair Value Gaps
Imbalances in market prices occur when there is a significant disparity between supply and demand, leading to inefficiencies where an asset does not trade at its fair value.
Typically, the price seeks balance after an imbalance, returning to the price area where it occurred. These areas of imbalance can also serve as support and resistance levels.

Fair Value Gap (FVG):
Represents an imbalance between buyers and sellers in the market, creating a 'gap' where the price will return to fill unfilled orders and restore balance. The Price Action Toolkit automatically identifies and marks FVGs on your chart.Bullish fair value gaps occur when the current price low is higher than the price high from two bars ago. Conversely, bearish fair value gaps arise when the current price high is lower than the price low from two bars ago.

Inversion Fair Value Gaps
An Inversion Fair Value Gap (IFVG) is an invalidated Fair Value Gap (FVG) that signifies a change in the market’s momentum, indicating a potential trend reversal. The Price Action Toolkit automatically identifies and displays IFVGs on your chart.
Inverse fair value gaps are essentially mitigated fair value gaps and can be used to identify retest areas.
A mitigated bullish FVG leads to a bearish inverse FVG, signaling that we can expect price to retrace upward and retest the area. Conversely, a mitigated bearish FVG results in a bullish inverse FVG, indicating that we can expect price to retrace downward and retest the area.
To enhance efficiency, inverse FVGs are always based on mitigating the most recent detected FVG, ignoring any earlier historical FVGs that may also be affected.
Double FVG
Double Fair Value Gaps, also known as balanced price ranges, occur when the areas of two Fair Value Gaps overlap. This overlapping area indicates a new imbalance.
A bullish Balanced Price Range is created when a new bullish Fair Value Gap overlaps with a previous bearish Fair Value Gap. Conversely, a bearish Balanced Price Range forms when a new bearish Fair Value Gap overlaps with a prior bullish Fair Value Gap.
Volume Imbalance
Volume imbalances are market imbalances characterized by two adjacent candles with non-overlapping bodies, while their wicks overlap. These imbalances are more commonly found in stocks and in the shorter timeframes of cryptocurrencies and forex pairs.
Opening Gap
Opening gaps are market imbalances characterized by two adjacent candles with non-overlapping wicks, creating an empty area. These imbalances are often found in stocks as well as on shorter timeframes for cryptocurrencies and forex pairs.
Mitigation Methods
Once the price breaks a highlighted imbalance area, it is considered “mitigated” and will automatically disappear. In the Price Action Suite indicator, users can set the condition for any imbalance to be regarded as mitigated through the Mitigation Method setting.
Premium & Discount Zones
Premium and Discount zones highlight three specific price areas: one upper area (premium), one central area (equilibrium), and one lower area (discount).
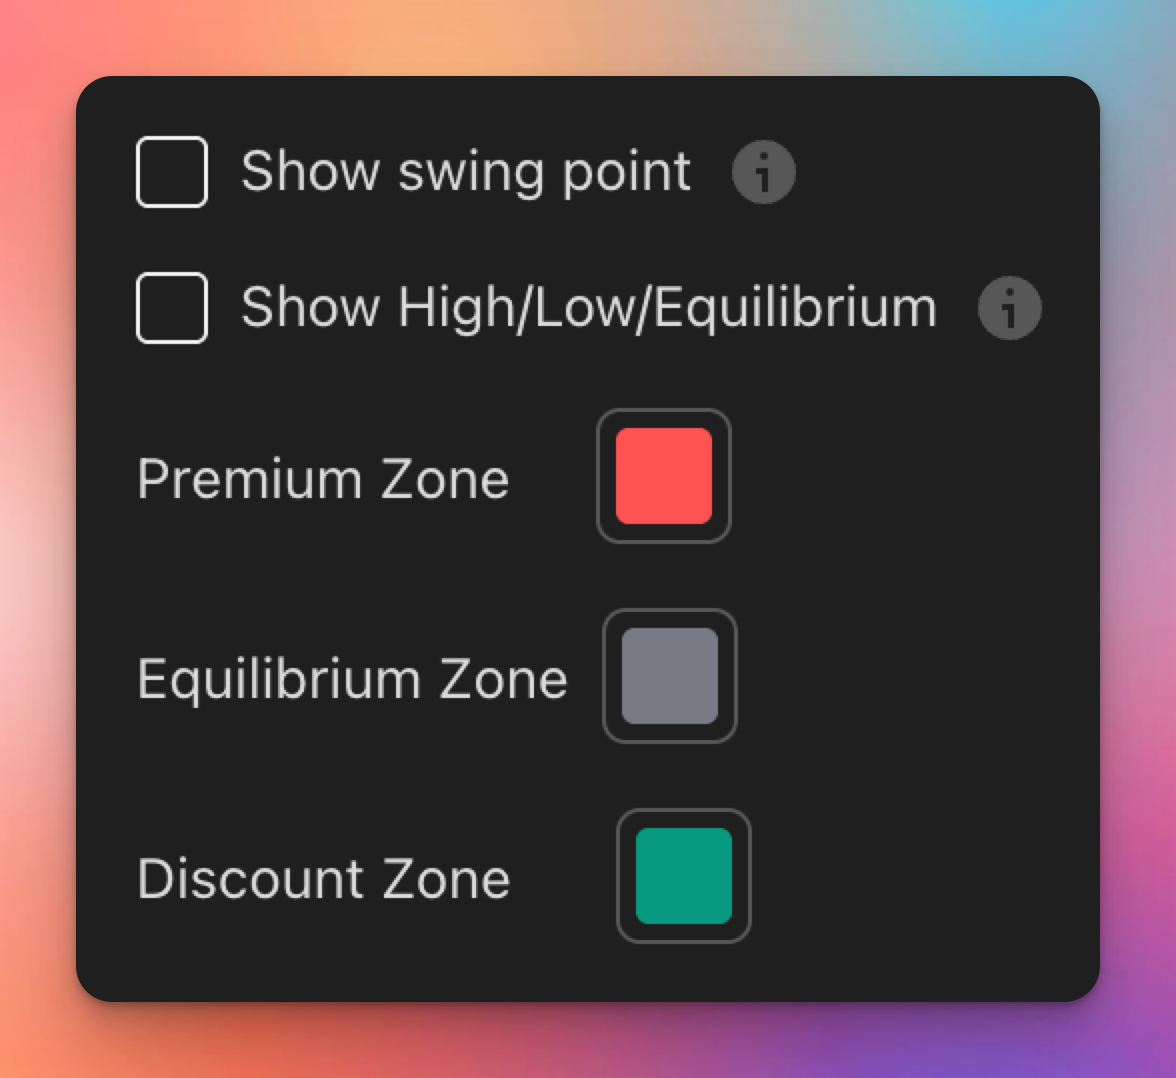
Premium and discount zones highlight three specific price areas: one upper area (premium), one central area (equilibrium), and one lower area (discount).

These areas can be used to know when an event is occurring at a premium, discount, or within an equilibrium zone.
Additionally, each area can serve as support or resistance.
Highs & Lows MTF
It is common for traders to use the maximum and minimum price values reached on a previous day, week, month, or over specific periods as support and resistance levels.

The toolkit can return levels based on the maximum and minimum price values reached during:
- The previous day
- Mondays
- The previous week
- The previous month
- Quarters

Each can be displayed from the HIGHS & LOWS MTF setting section.